
Understanding the European Innovation Scoreboard
In my everyday work, I collaborate with teams from different European countries. These teams vary in their experience, technical knowledge, and cultural approach. Some countries’ teams are more open to new ideas and innovation, actively seeking and suggesting new things, while others are less inclined. In trying to understand the differences among countries and how they compare, I found the European Innovation Scoreboard.
The EU has been publishing this scoreboard since 2001, and it’s like a benchmark for analysing how well different countries are doing in terms of innovation:
- detailed evaluation of each country’s strengths and weaknesses in innovation, helping them figure out areas where they can improve.
- allows for customized comparisons.
- shows country profiles, highlighting strengths, weaknesses, trends, and connections between different factors.
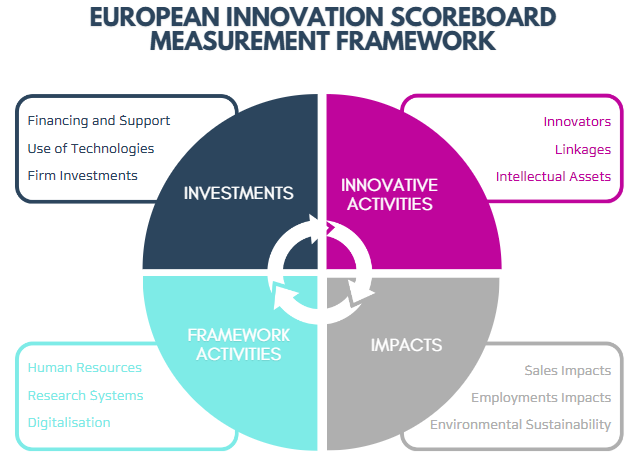
It assesses the strengths and weaknesses of their systems in four main areas:
- Framework conditions,
- Investments,
- Innovation activities
- Impacts.
These areas are further broken down into 12 dimensions, which altogether include 32 indicators. Each main group and indicator carries equal importance in calculating the overall performance score, known as the Summary Innovation Index (SII).
EU Innovation Landscape 2023 Segmentation
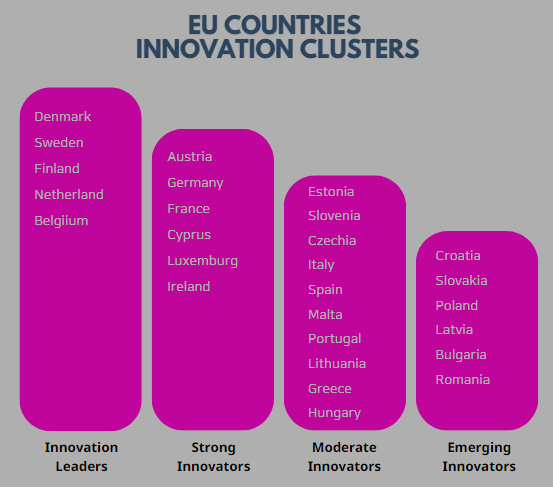
The recent edition of EIS released on July 6, 2023, revealed existing disparities between different member states whose innovative score can be stratified into four groups:
- Innovation leaders
- above 125% of the EU average
- led by Denmark, Sweden, Finland, Netherland and Belgium
- Strong innovators
- between 100% and 125% of the EU average
- represented by Austria, Germany, France, Cyrus, Luxembourg and Ireland
- Moderate innovators
- between 70% and 100% of the EU average
- comprising of Estonia, Slovenia, Czech Republic, Italy, Portugal, Spain, Malta, Lithuania, Greece and Hungary
- Emerging innovators
- below 70% of the EU average
- which is polite naming of lagging behind group of countries like Croatia, Slovakia, Poland, Latvia, Bulgaria and Romania
A closer look at geographical distribution of member states across various stratus reveals that geographical concetration persists, with Northern and Western Europe being home to the majority of Innovation Leaders and strong Innovators, while Southern and Eastern Europe host the majority of Moderate and Emerging Innovators.
Key Facts and Findings in Innovation Landscape 2023
Between 2022-2023, the annual innovation performance across the EU reduced at a rate of 0.6%. Compared to 2022, performance for the EU has improved in five dimensions:
- the strongest in the Use of information technologies and Digitalisation, and decreased in seven dimensions,
- most strongly in Linkages.
- individual indicators, the highest increase is in Enterprises providing ICT training, Broadband penetration, and Sales of innovative products,
- highest decrease in Job-to-job mobility of Human Resources in Science and Technology and New doctorate graduates.
A comparative analysis between member states ranked Denmark (149.24) is the new top innovator, overtaking Sweden (145.92), which had topped the board in the last few years, while other member states that closely followed were Finland (145.63), the Netherlands (139.56), and Belgium (136.43).
The rise of Denmark as top innovator member states was partially due to its much stronger performance in non-research and development innovation expenditures and sale of its innovative products and partially due to decline in Swedish innovative prowess between 2022-2023.

Across other tier, Hungary made a jump from emerging to moderate innovators due to improvements in broadband and foreign doctorate student increase with the study period.
However, a substantial improvement was noted across 19 members with key performance being Czech Republic, Bulgaria and Poland; all recording 5% improvement in their innovative score index. On the other end, a decline was experienced across eight member states. Despite negative improvement between 2022-2023, EU records 8.5% improvement in its innovation since 2016 – which shows an improvement in its innovative trend in a long run.
With the same period, then 25 member states including Cyrus, Estonia, Greece and Czechia recorded more than 20 points jumps following steady improvements in indicators such as business process innovators, international scientific co-publications, job-to-job mobility of human resources in science & technology, and venture capital expenditures.
Equally disparities among member states have reduced significantly across all groups except in the emerging group where difference between them and next tier (moderate group) remain high.
EU vs. Leaders in Innovation around the world
When placed in a global context, the EU, while a hub of innovation, lags behind countries like Canada, South Korea, the United States, and Australia. South Korea boasts an average innovation score of 126, surpassing the EU’s innovation leaders. These findings point to a critical need for the EU to address the disparities in innovation performance among its member states and to develop comprehensive policies that foster a more uniform level of innovativeness across the region. Europe stands as a beacon of creativity and progress but falls short of Canada, South Korea, the United States and Australia, who had the higher innovation score above 100 in 2023.
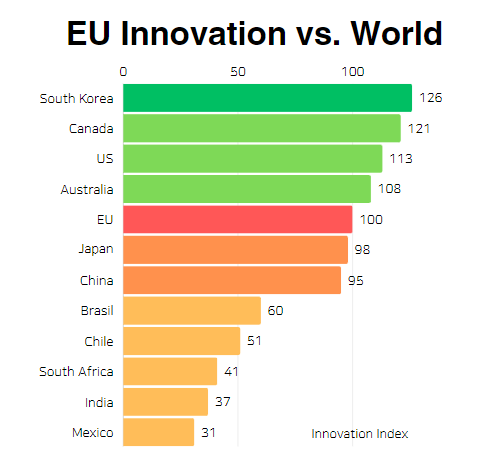
However, it is other key global giants such as China, Japan, India, Brazil, Mexico and South Africa. South Korea is the most innovative region with average score of 126, which is far much below the mean average of 143.6 recorded by innovation leader of Europe. This means, even if EU as region lags the United States, Canada, Australia and Korea, it’s still having the home of leading innovators. Changes in innovation index of EU is low compared to other part of the world. Its only above Mexico, Japan, Australia and South Africa and below the rest group for period between 2016 and 2023. Such factors are contributed by stability of innovation between member states and great disparities between its member states.
What EU needs for Leadership in Innovation
From a professional standpoint, it is evident that the EU should intensify its efforts in creating innovative programs that foster education on technology and provide substantial funding for innovative companies. To stay globally competitive, the European Union must prioritize the development of a robust ecosystem that not only nurtures technological literacy but also incentivizes and supports businesses driving innovation.
Investing in comprehensive educational programs focused on emerging technologies is crucial. This includes initiatives aimed at equipping the workforce with the skills needed to navigate the evolving digital landscape. By placing a strong emphasis on technology education, the EU can ensure that its citizens are well-prepared for the demands of the modern economy.
Furthermore, substantial funding should be directed towards innovative companies, especially startups and small enterprises, which often serve as the primary drivers of groundbreaking ideas. Creating accessible funding mechanisms and streamlining bureaucratic processes will encourage entrepreneurship and contribute to the growth of a vibrant innovation ecosystem.
Looking on EU Innovation Leaders we can take key learnings how to make also rest of Europe more competitive with rest of world
- Investment in Research and Development (R&D): Leading countries allocate significant resources to R&D, both from the public and private sectors. This includes funding for universities, research institutions, and businesses.
- Educational Excellence: These countries usually have strong education systems that produce a skilled and innovative workforce. Emphasis on STEM (Science, Technology, Engineering, and Mathematics) education is common.
- Collaboration Between Academia and Industry: Successful innovators foster strong partnerships between academic institutions and businesses. This collaboration helps turn research into practical applications and products.
- Supportive Business Environment: Countries that lead in innovation often have business-friendly environments, including flexible regulations, intellectual property protection, and incentives for innovation.
- Entrepreneurship and Start-up Ecosystem: Encouraging entrepreneurship and having a vibrant start-up ecosystem contribute to innovation. Support for small and medium-sized enterprises (SMEs) is crucial.
- Government Policies and Support: Effective government policies play a vital role. This includes innovation-friendly policies, funding initiatives, and strategic plans that promote a culture of innovation.